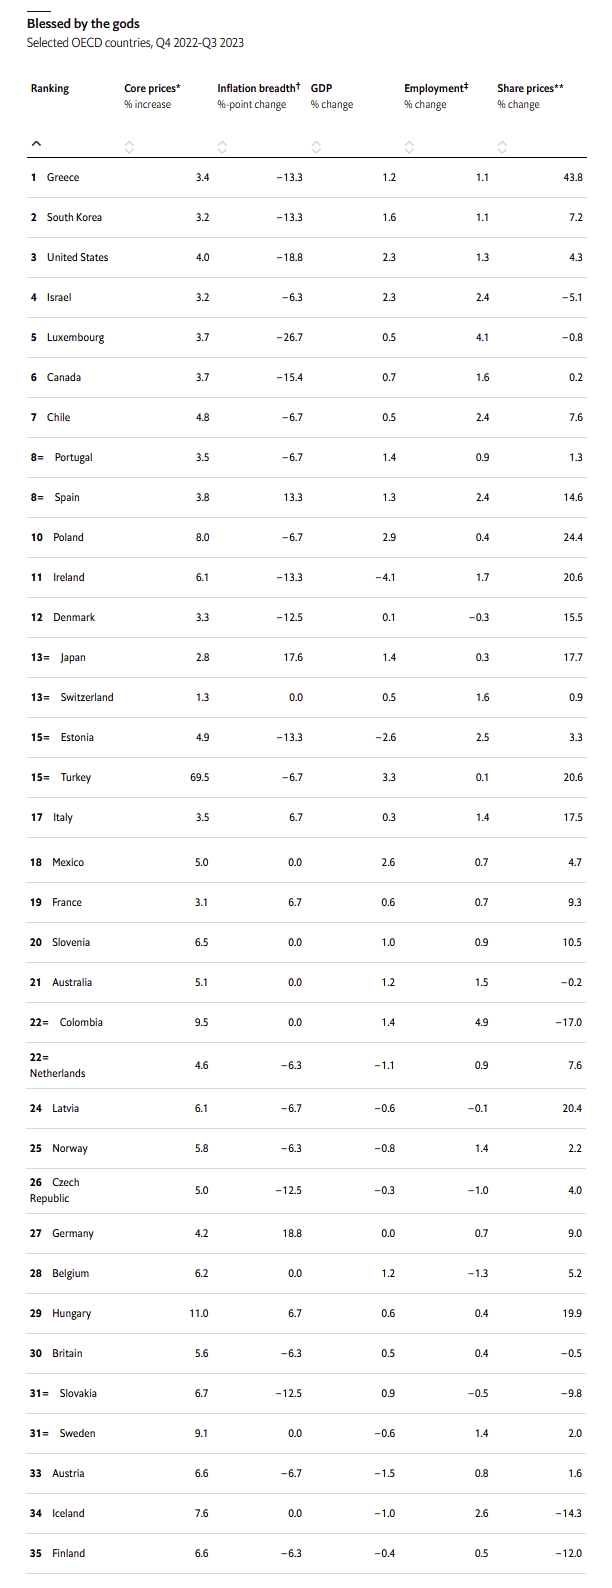
Summary
For the last few years, in late December or early January, the Economist usually releases a chart with a title something like "which countries did the best".
Types of markets
Ranking
Above, there are multiple types of options. The first, type is like this:
Denmark [0% for 11th, 10% for 10th, 100% for 1st]
This means that the first 10 places will be scored, counting down 100% to 0%.
Ties resolve with the nominal value (8=, 8= => 80% for both)
A vs B
Another type is "A vs B" markets; these resolve by whether A will beat B. If A wins, 100%. If B wins, 0%. If they tie, then 50%. This is based on the ranking, and note that the Economist includes ties (in 2023, designated by a sequence of rank numbers such as "8=, 8=, 10=" which means there were two countries tied for 8th, to preserve logic, therefore 9th was skipped. If A appears in the list, and B doesn't A wins. If neither appears, then NA.
A vs B win margin
For these, we look at how many places ahead A is. If tied or behind or missing, score is 0%. If A is ahead by 1 place (for example, 1st vs 2nd place) then 10%. If by 10 or more places, score is 100%.
Best in region
Regions are defined based on this map:
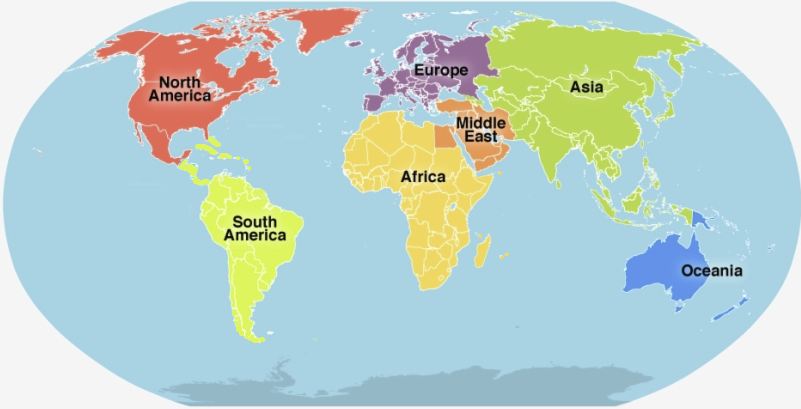
So the regions are
North America
South America (including South America and the Carribean)
Africa
Middle East
Europe
Asia
Oceania (Oz NZ and pacific island nations)
Details on data
This chart has included factors like the following, but with some variations:
GDP
Household income per person
Share Prices
Investment
Public Debt to GDP Ratio
Core Prices
Employment
Inflation Breadth
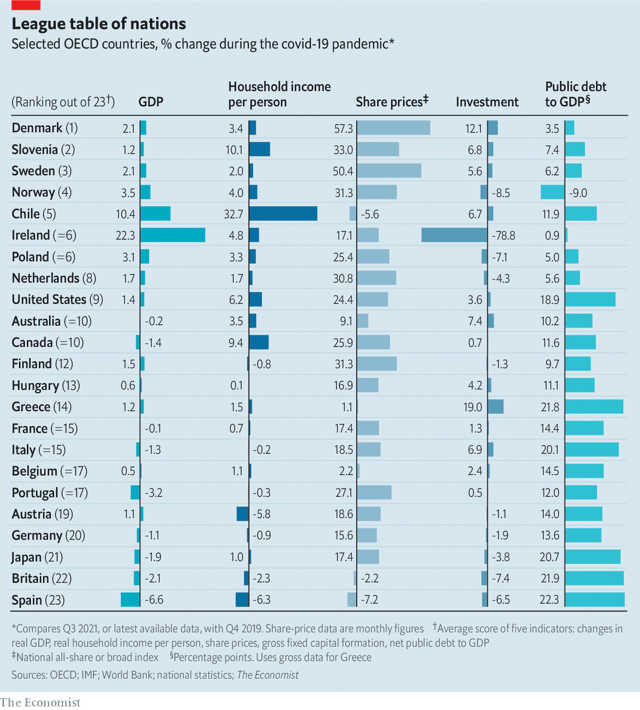
Historical Results
Combined:
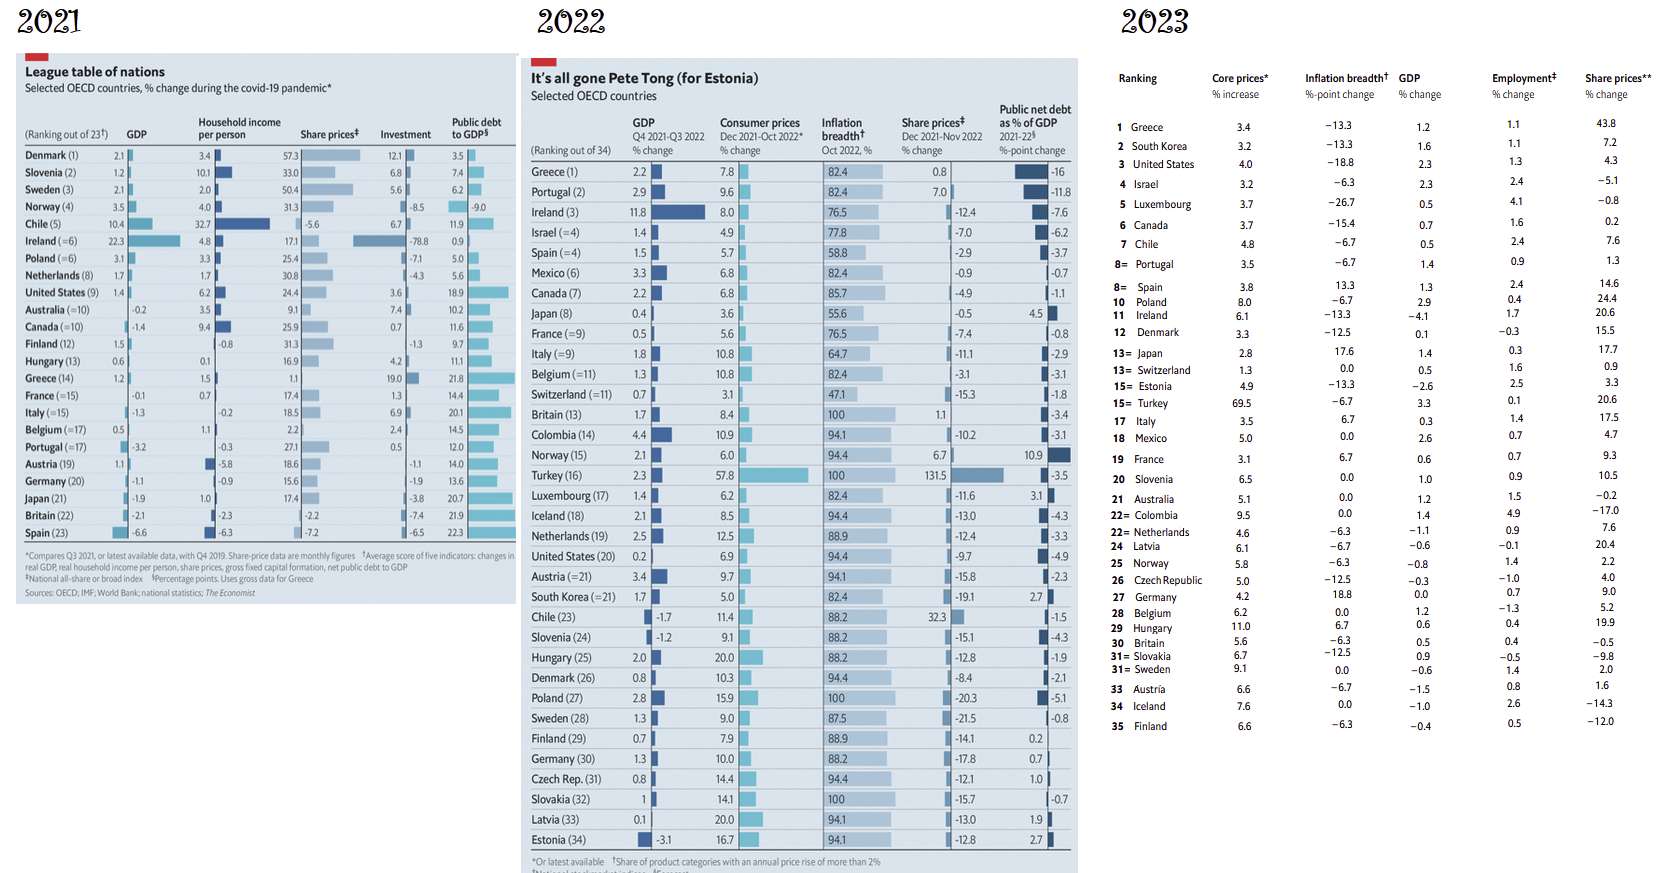
2021 results: https://www.economist.com/finance-and-economics/which-economies-have-done-best-and-worst-during-the-pandemic/21806917
2022 results: https://www.economist.com/finance-and-economics/2022/12/18/2022s-unlikely-economic-winners
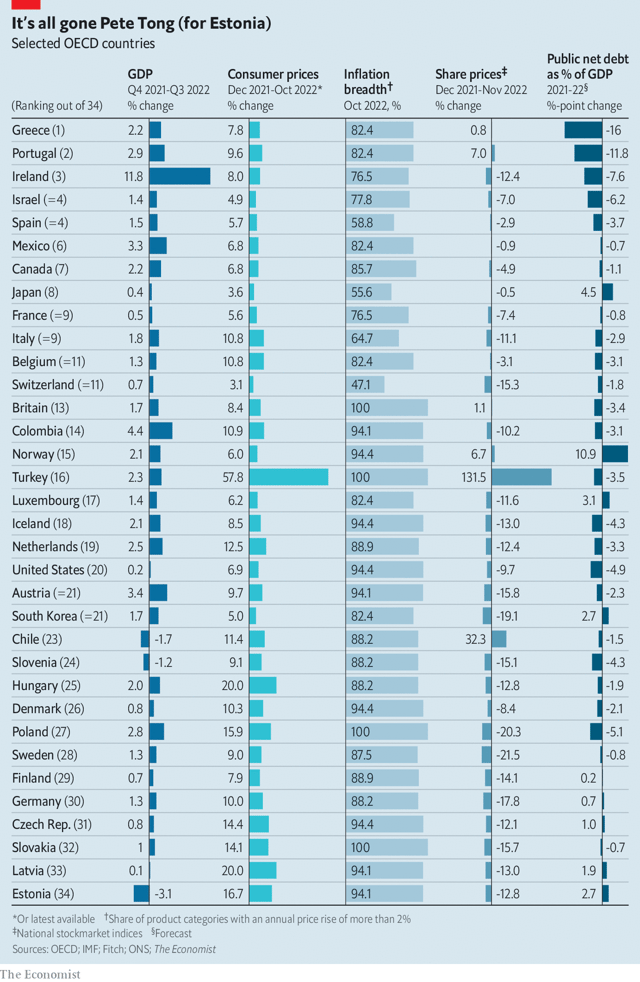
2023 results:
https://www.economist.com/finance-and-economics/2023/12/17/which-economy-did-best-in-2023
