Resolution criteria
This market will resolve to "Yes" if the S&P 500 Index's closing value on Oct 31, 2025, is within 1% of its all-time high.
If the market reaches a new all time high, that will be what the market must be within 1% of for the market to resolve to "Yes." If the closing value falls outside this range, the market will resolve to "No.". If the market closes exactly 1% below all time high this will resolve to 50%
Update 2025-10-13 (PST) (AI summary of creator comment): "Within 1%" means: closing value > 0.99 × all-time high
(Not: 1.01 × closing value > all-time high)
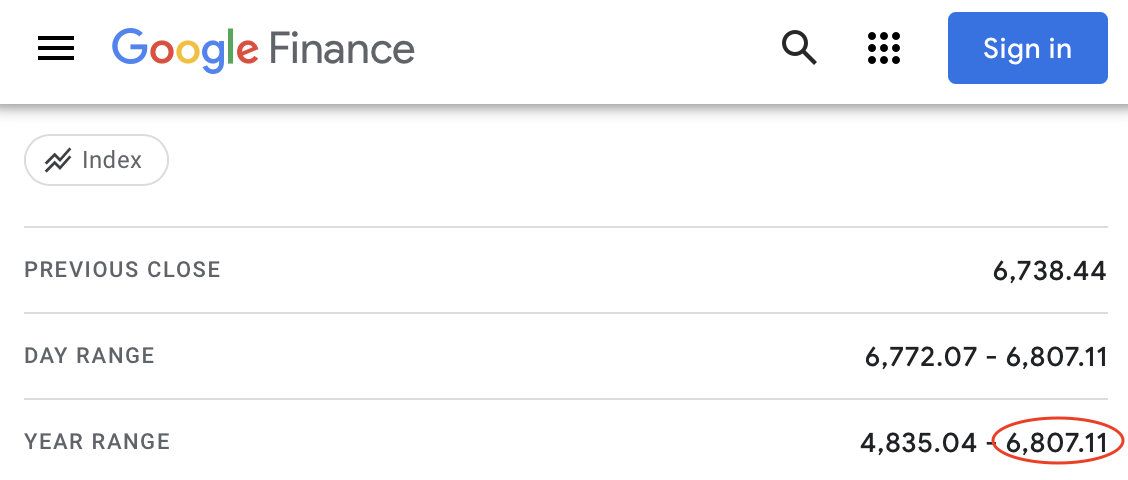
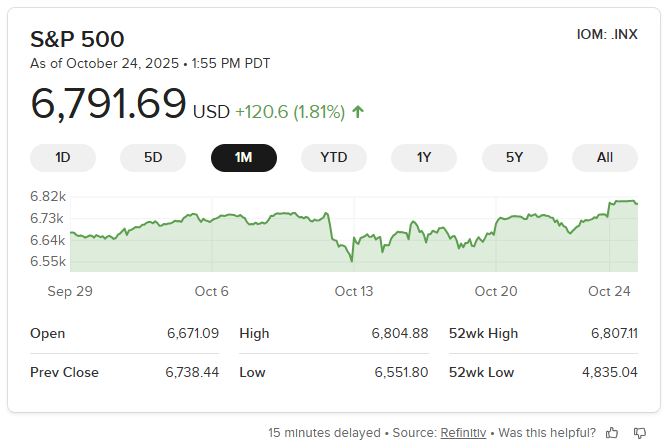
Update 2025-10-31 (PST) (AI summary of creator comment): Creator will use Google Finance as the data source for S&P 500 closing values and all-time high determination.
Update 2025-10-31 (PST) (AI summary of creator comment): Creator confirms they are using Google Finance data showing an all-time high of 6879 (not 6920 from other sources) for resolution determination.
 1,000
1,000 1.00
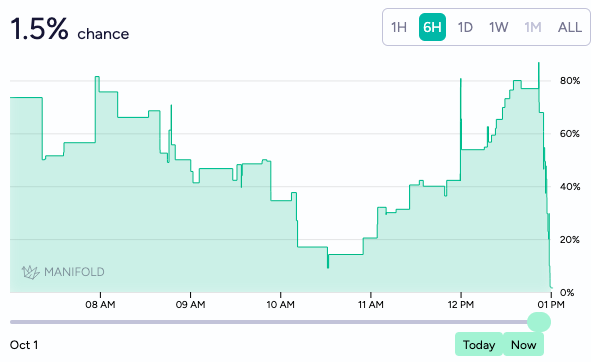
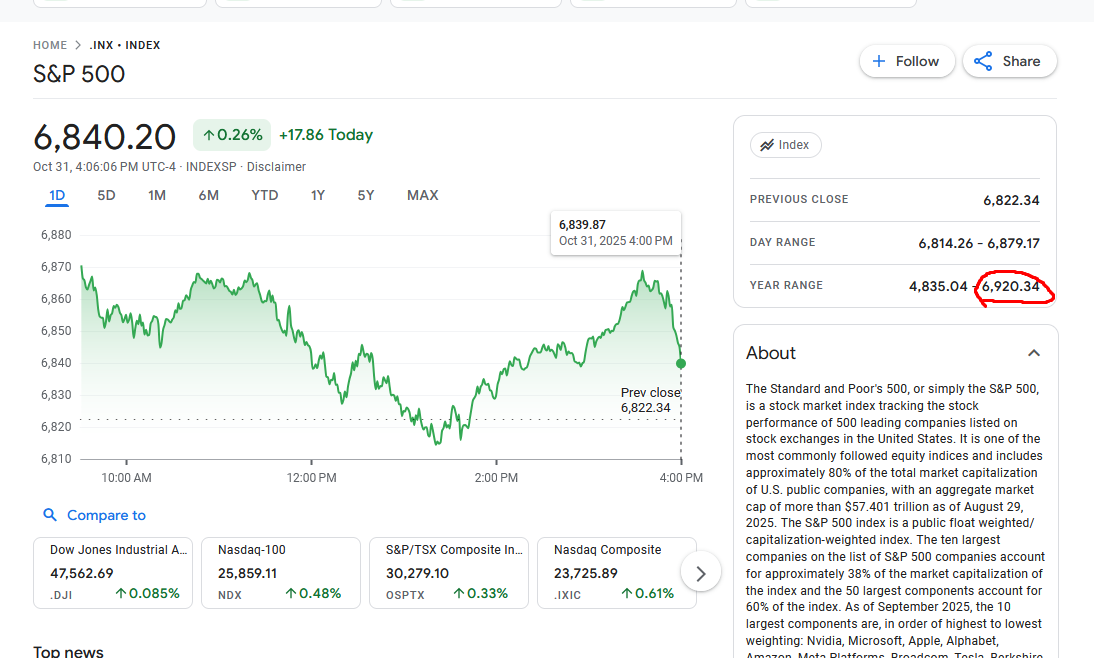
1.00@Magnify resolves NO, ATH is 6920.34, 99% of that is 6851.14, market closed at 6840.
crazy day for this market
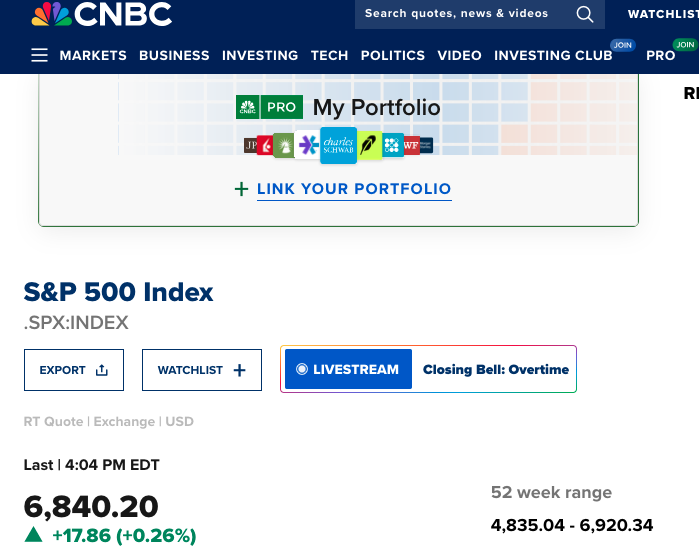
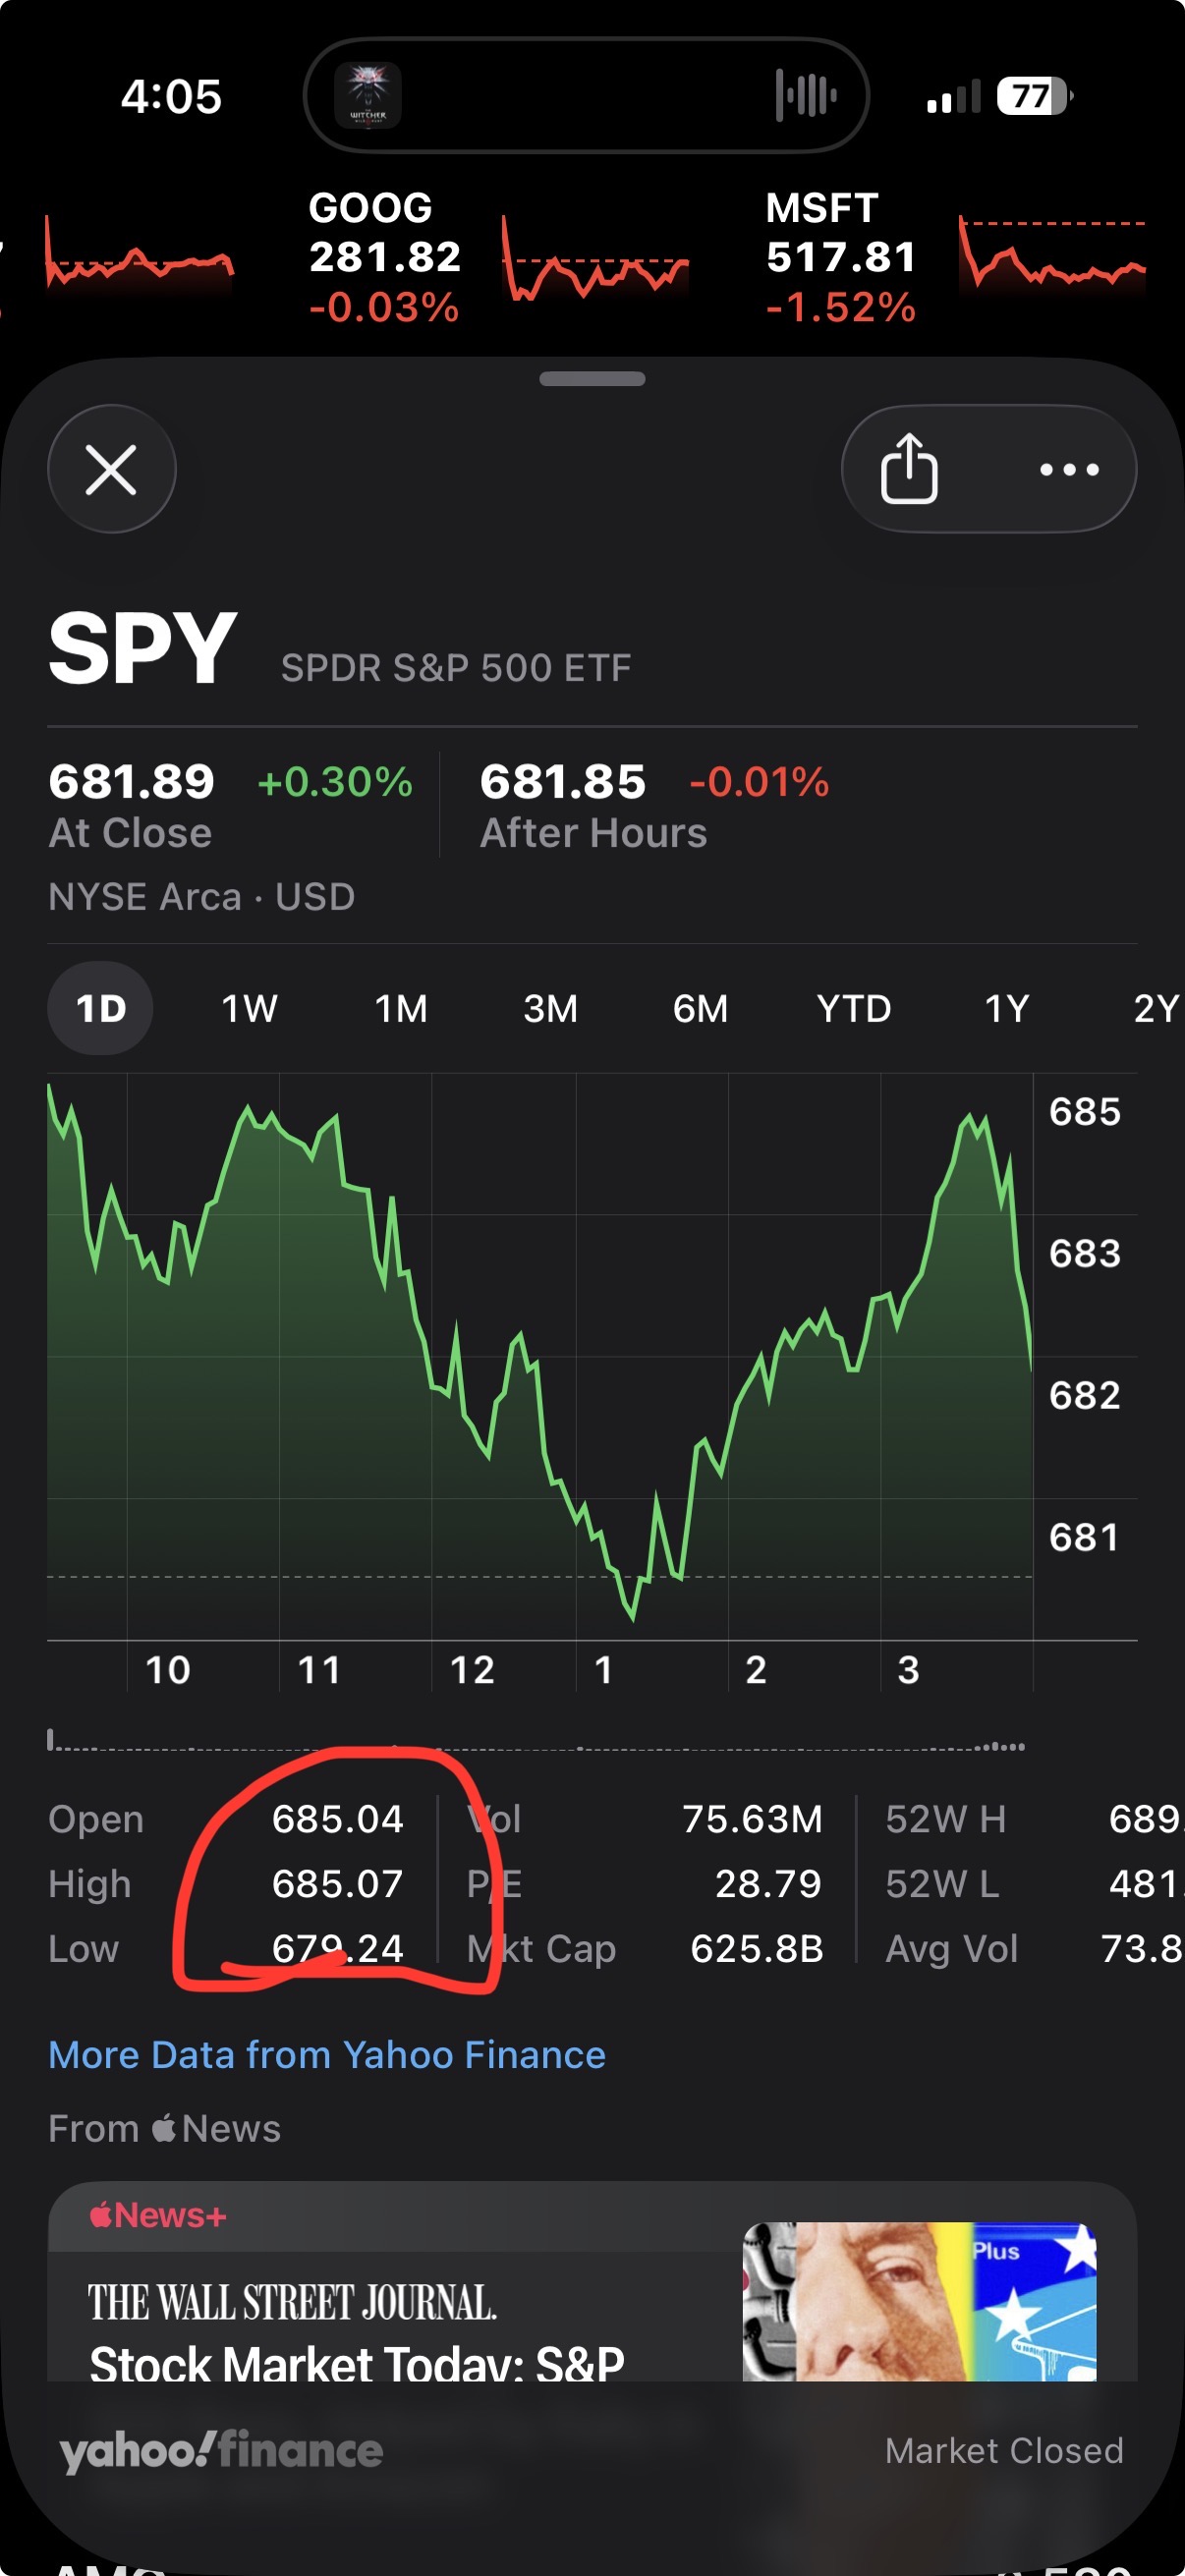
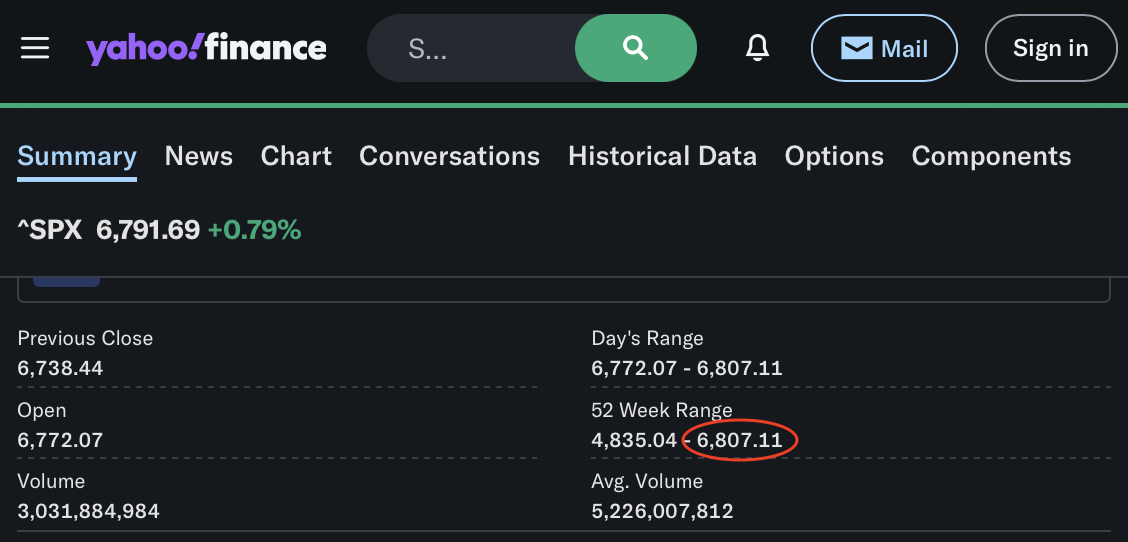
@Magnify that (first screenshot) is the SPY ETF and not the actual index
https://www.google.com/finance/beta/quote/.INX:INDEXSP google finance also shows 6920
@SaviorofPlant yeah it updated off my first check. Confused the hell out of me. Unlucky haha
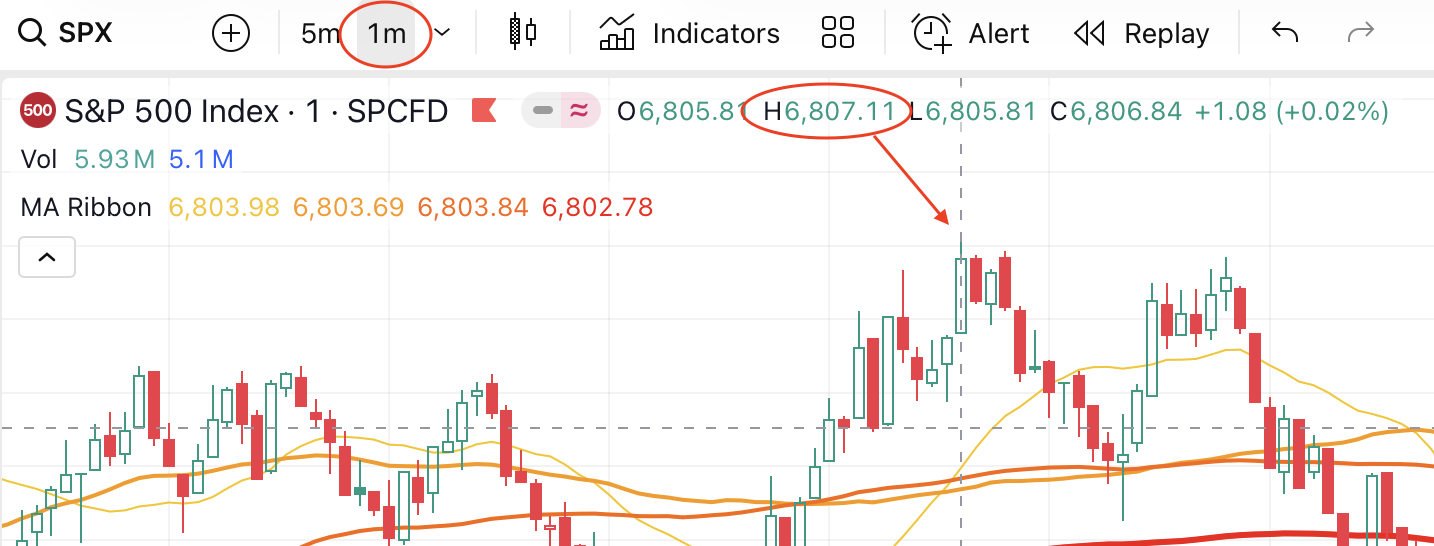
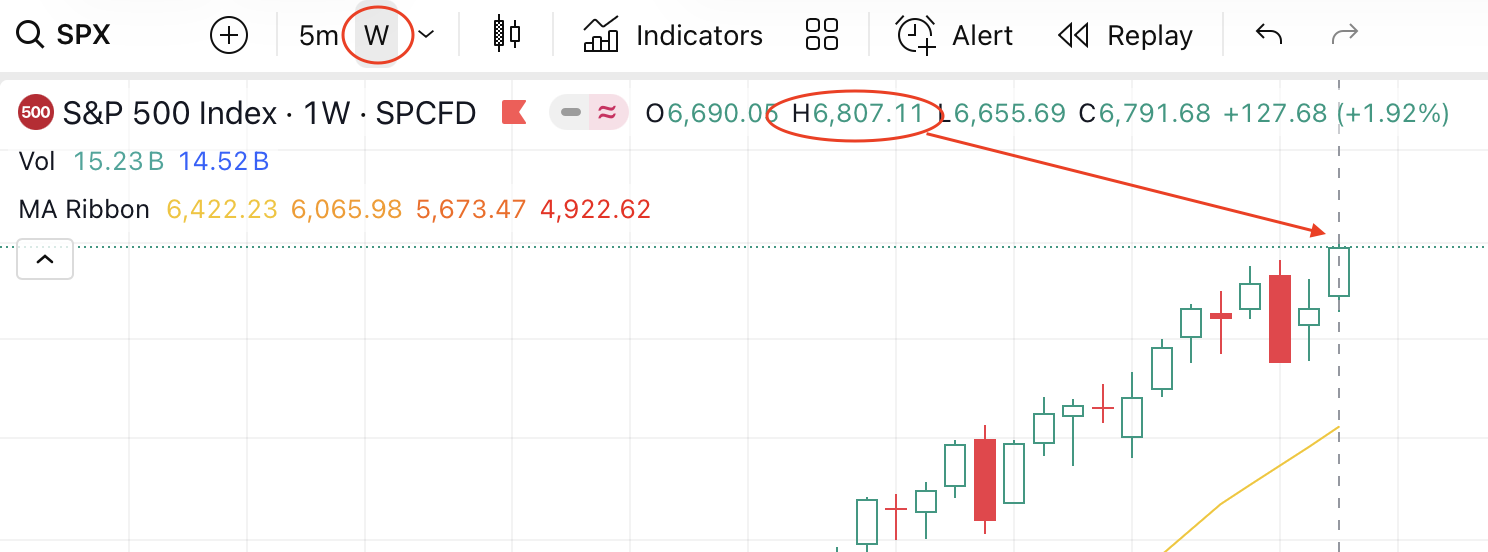
@Magnify This does add small (though likely irrelevant) complications, as intra-day highs in turn depend on how finely divided the time series is i.e. how narrow the candles get. Currently, the intra-day high for the SP500 on Oct 24 can read 6807.11 or 6806.85 or 6804.88, as broader and broader candles are used.
@BorisBartlog ah I was kind of just going to look at apple stocks and see what it displayed “high” as, because that discounts aftermarket trading which is my intention. Generally I find that since it’s not the most volatile thing in the world it wouldn’t fluctuate so severely
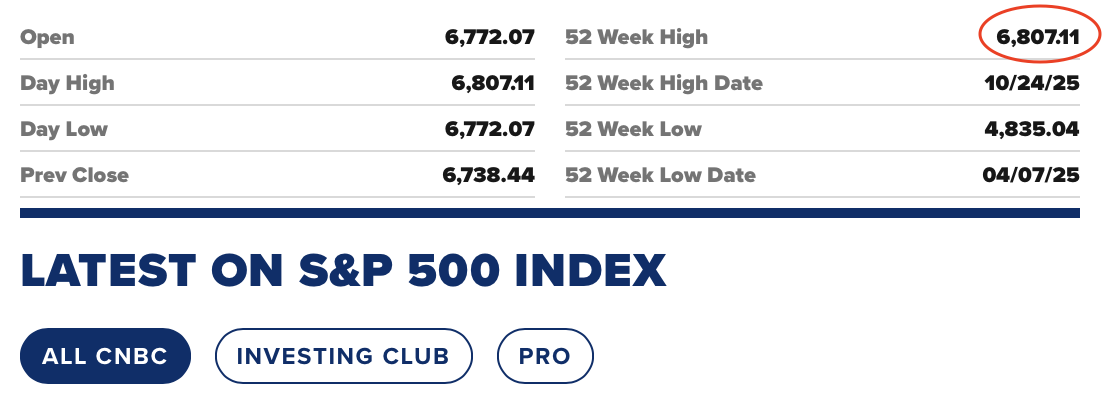
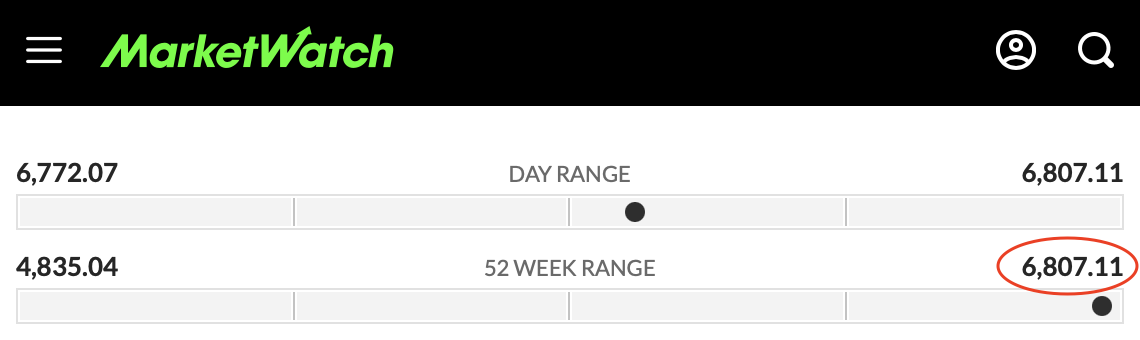
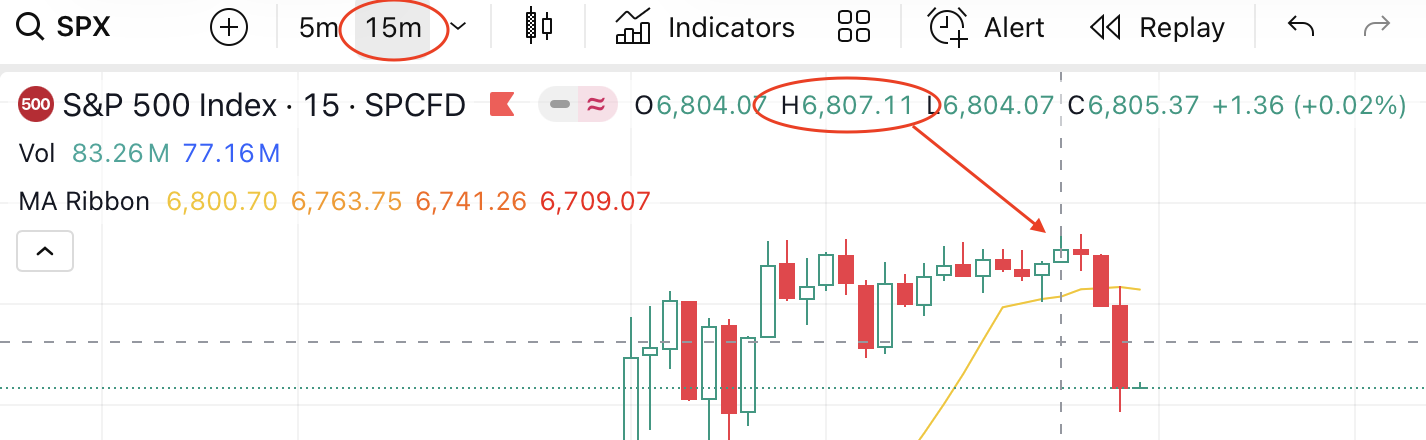
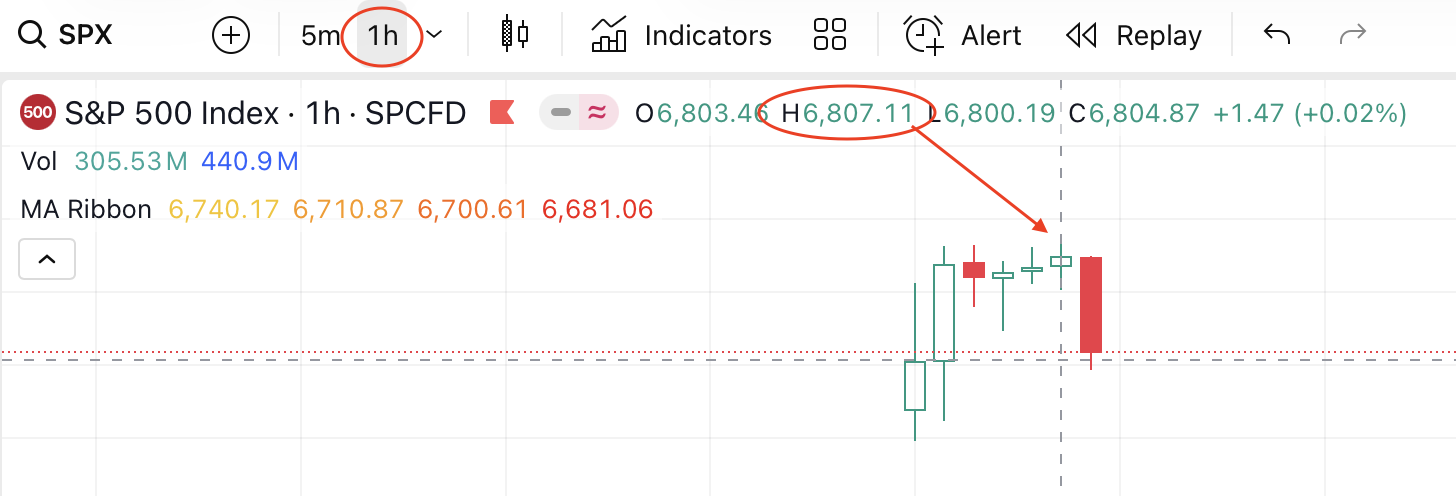
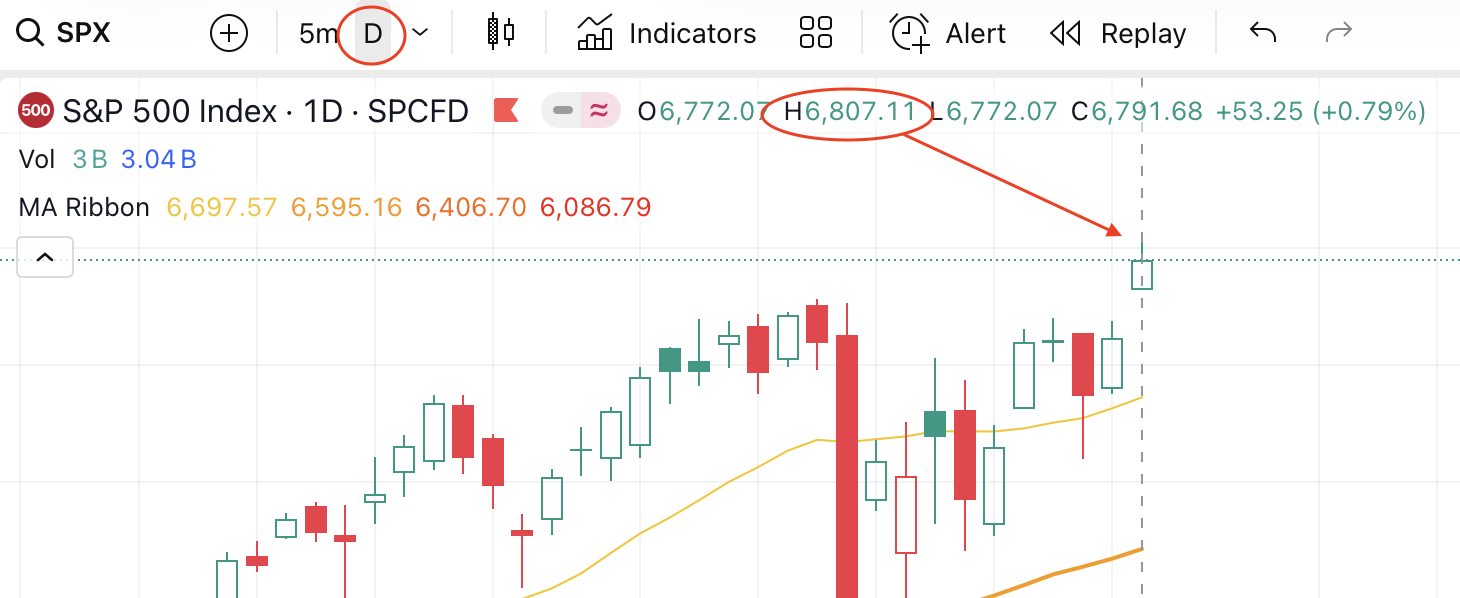
@BorisBartlog it's 6807.11 at any granularity of candles. The broader candles include all the data within the thinner ones, so the highest wick is still tracked. BTW, I'm pretty sure "all-time high" always means intraday high, as opposed to "all-time closing high".
@deagol Well, in principle it should be. Nonetheless there are certainly plenty of display options for this data that will happily show you different values for the high depending on the timeframe(s) you select.
@BorisBartlog what's your data source? i've never seen candles using anything other than OHLC data. I use TradingView but all others I've checked report the 52w-high as the same all-time intraday high.
TradingView
1min candles
15min candles
1h candles
1d candles
1w candles
@deagol Here's an example (this chart is the first thing that comes up if you look for SP500 on DuckDuckGo):
In fairness, it does get the 52wk high right ... but somehow doesn't manage to do the same thing for the claimed intraperiod high.
Anyway, your plethora of examples convinces me that this isn't a general problem, just some weird issue with the particular source I was looking at.
@BorisBartlog well, of course you won't get the highs on a line chart, it's only made of the closing data, not open-high-low-close (OHLC). To see the highs you must select candles or bars for the chart type.
@BorisBartlog Real growth happens when you follow proven advice. Thanks to Mrs. Lemanda Gulch’s trading system, I’ve made more than $280K in six months. Contact her via Telegram (@Lemandagulch).
@Magnify does "within 1%" mean:
A: close > 0.99*ATH, or
B: 1.01*close > ATH
it's less than a point of difference, but worth clarifying just in case. thanks!
if it's exactly at 1% [edit: I see this was in description]